


Property Crime

Personal Crime

Murder

Assault

Larceny

Rape

Battery

Crime Index

Motor Vehicle Theft

Burglary

Robbery

Total Crime

Security Operations
Homeland Security
Emergency Communications
Humanitarian Assistance
Emergency Management

Law Enforcement
Emergency Medical service
Windland Fire


Crime Report |
|||
| Lot Map |  |
|
|
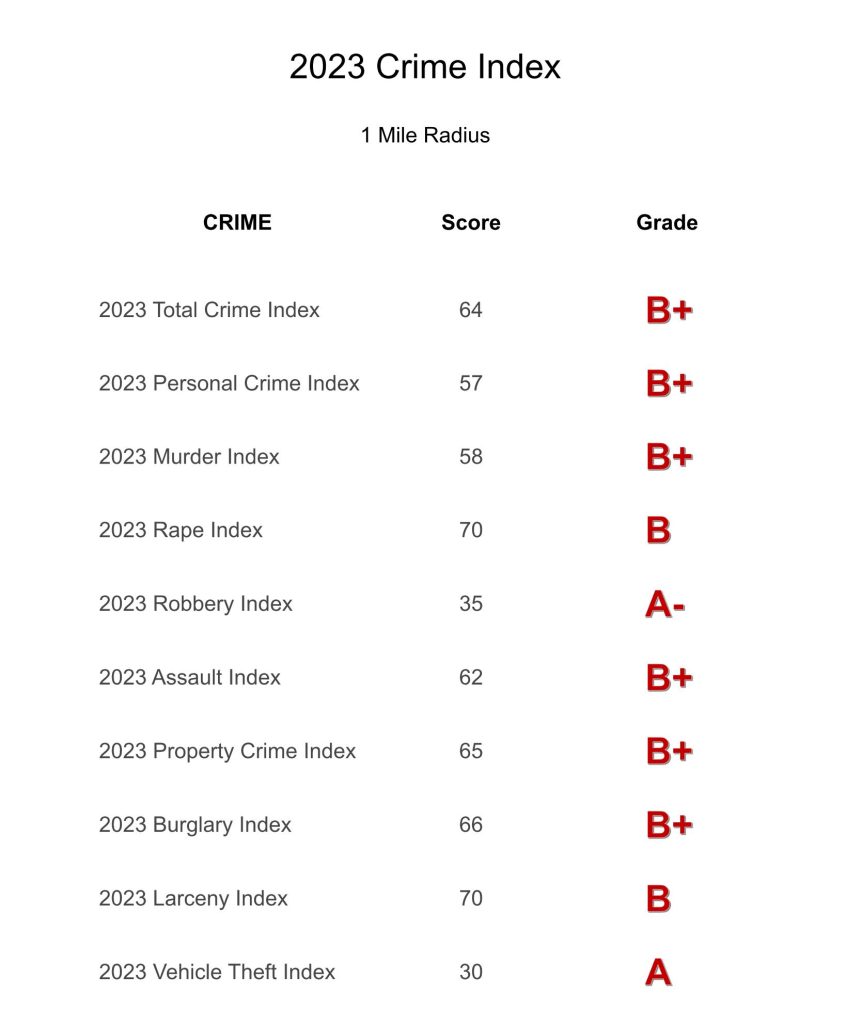
| Total Crime Map ( 1 Mile) | |
|
|
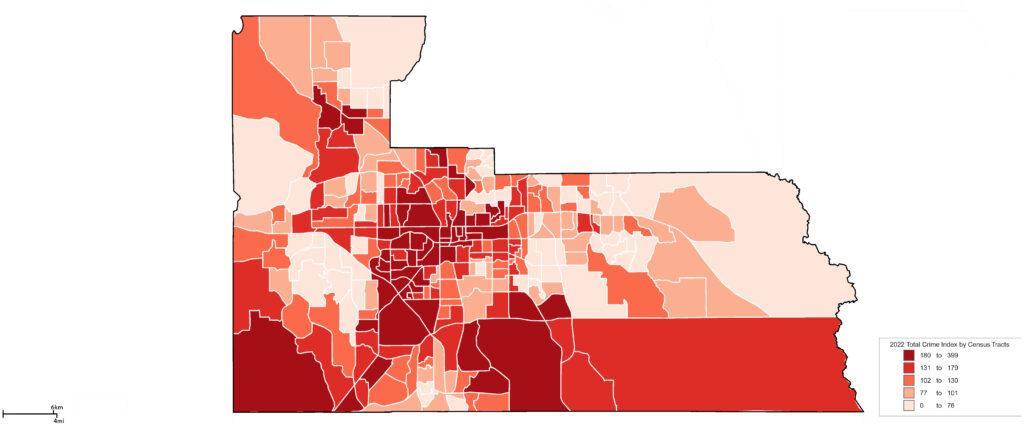
| Total Crime Map ( County) | |
|
|
| Report Card | |
|
|
| Personal Crime Map | |
|
|
| Property Crime Map | |
|
|
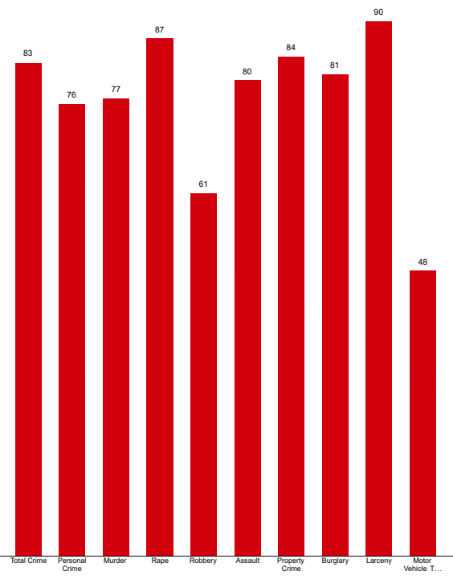
| Bar Chart | |
|
|
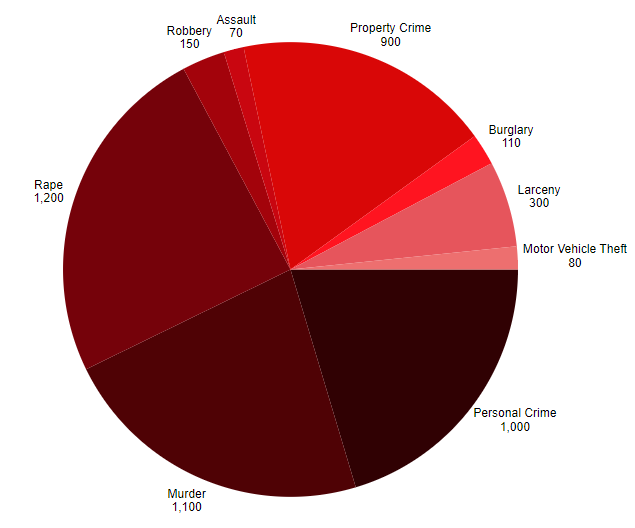
| Pie Chart | |
|
|
| Assault Map | |
||
| Assault Data Values | |
||
| Murder Map | |
||
| Murder Data Values | |
||
| Rape Map | |
||
| Rape Data Values | |
||
| Burglary Map | |
||
| Burglary Data Values | |
||
| Larceny Map | |
||
| Larceny Data Values | |
||
| Robbery Map | |
||
| Robbery Data Values | |
||
| Vehicle Theft Map | |
||
| Vehicle Theft Data Values | |